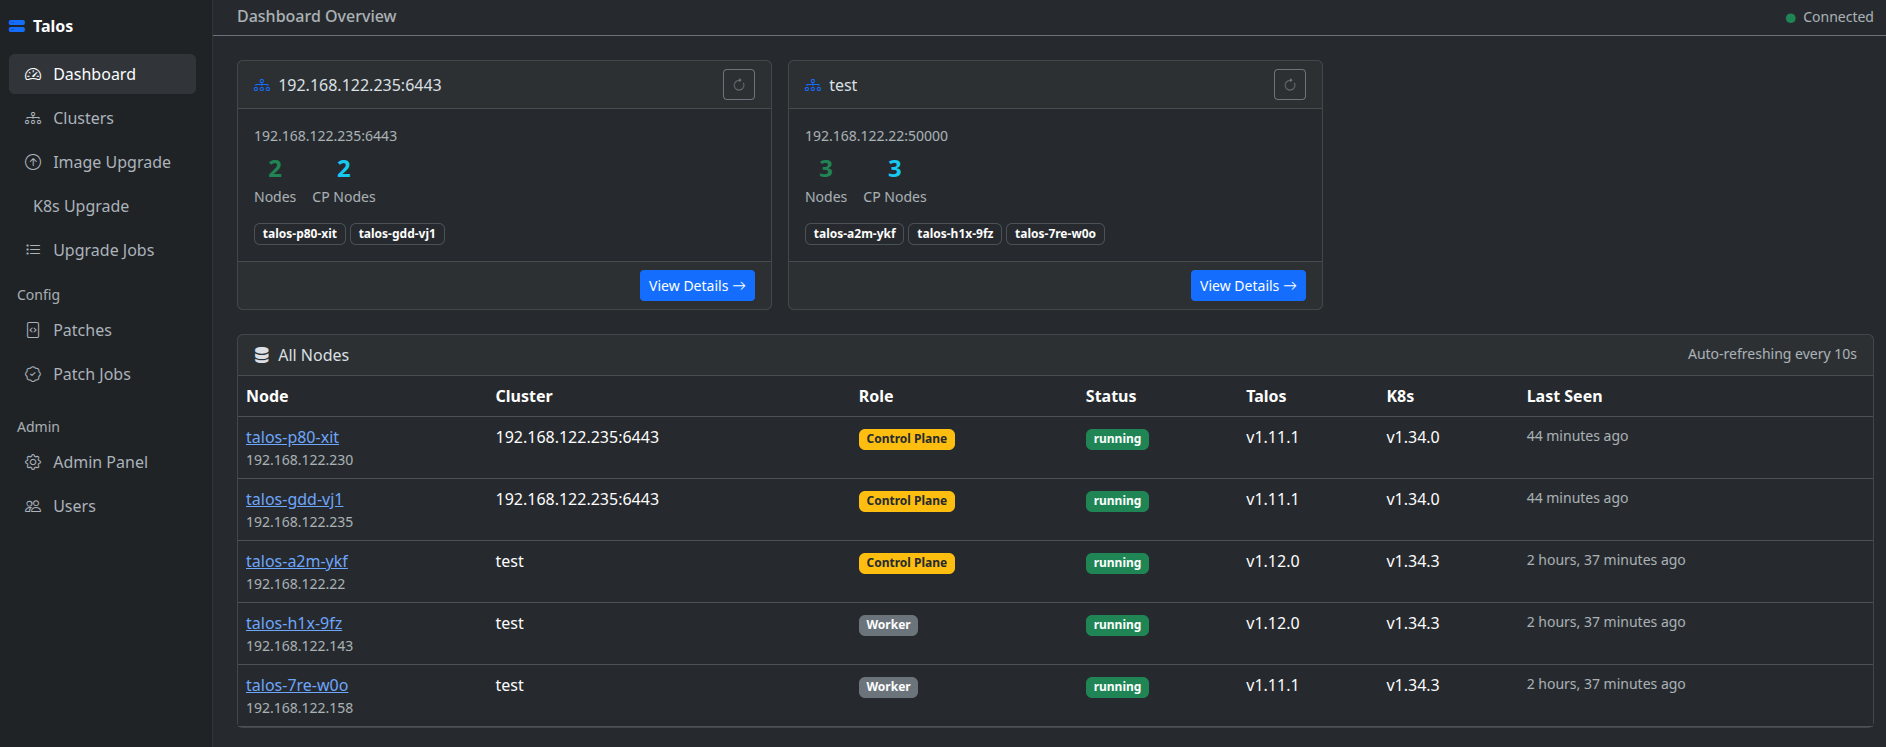
Open Source / MIT License

Talos Dashboard

A web-based management interface for Talos Linux clusters. Real-time node operations, machine config management, upgrades, and patch workflows — all from your browser.

View on GitHub Installation

Features

Cluster Management

Add, edit, and delete clusters. Download talosconfig and kubeconfig directly from the UI.

Node Operations

Reboot, shutdown, reset, restart services, and view live logs per node via WebSocket.

Machine Config

View and edit full machine configurations with a YAML editor. Apply changes with selectable modes.

Patch Templates

Save JSON or YAML patch templates and apply them to all nodes, control planes, or workers.

Upgrades

Image and Kubernetes upgrades with real-time streaming output per node.

Resource Monitoring

CPU, memory, disk usage and process list per node refreshed on demand.

Bootstrap Wizard

3-step cluster bootstrap: generate configs, edit YAML in the browser, apply and bootstrap etcd.

Role-Based Access

Three roles: admin, operator, viewer. Enforced on every view and operation.

Stack

Django 5.x Django Channels 4.x Celery Redis Bootstrap 5 HTMX CodeMirror 5 SQLite / PostgreSQL talosctl WebSocket

Screenshots

Dashboard Overview

Cluster list with node counts, status summary, and quick-access actions.

Talos Dashboard overview showing cluster list with node counts and status

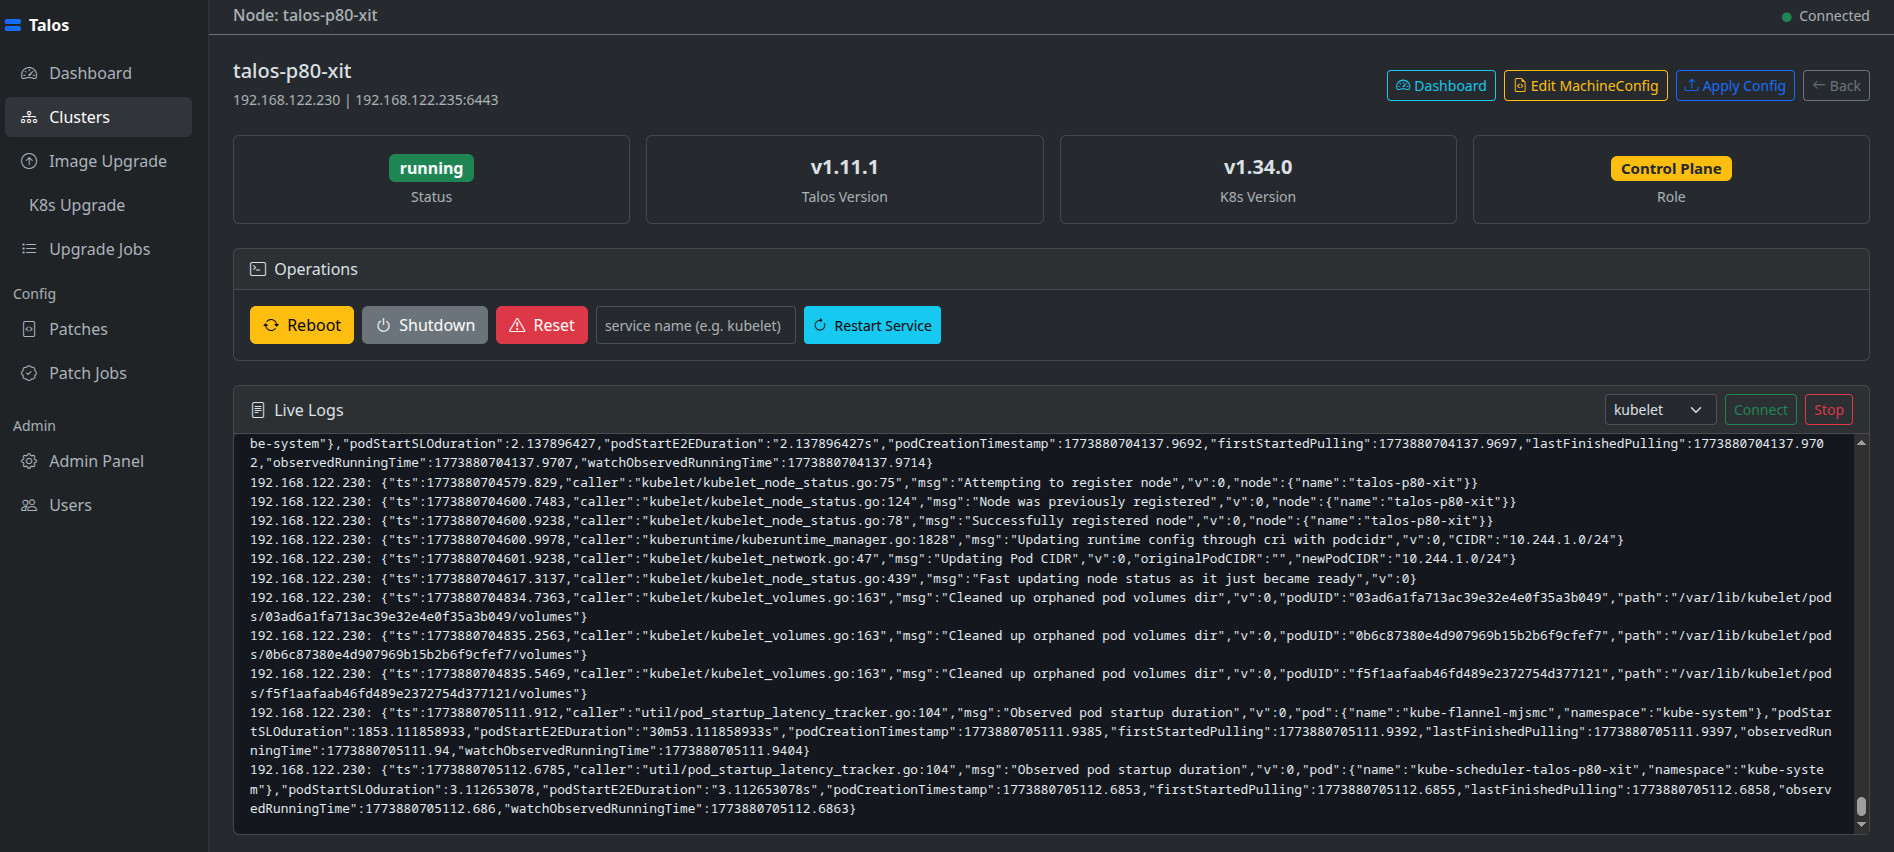
Cluster & Node Detail

Node list with live status, reboot / shutdown / reset / restart-service controls, version info, and real-time log streaming.

Cluster and node detail page with node operations and live log streaming

Resource Usage & Processes

Per-node CPU, memory, disk metrics and running process list.
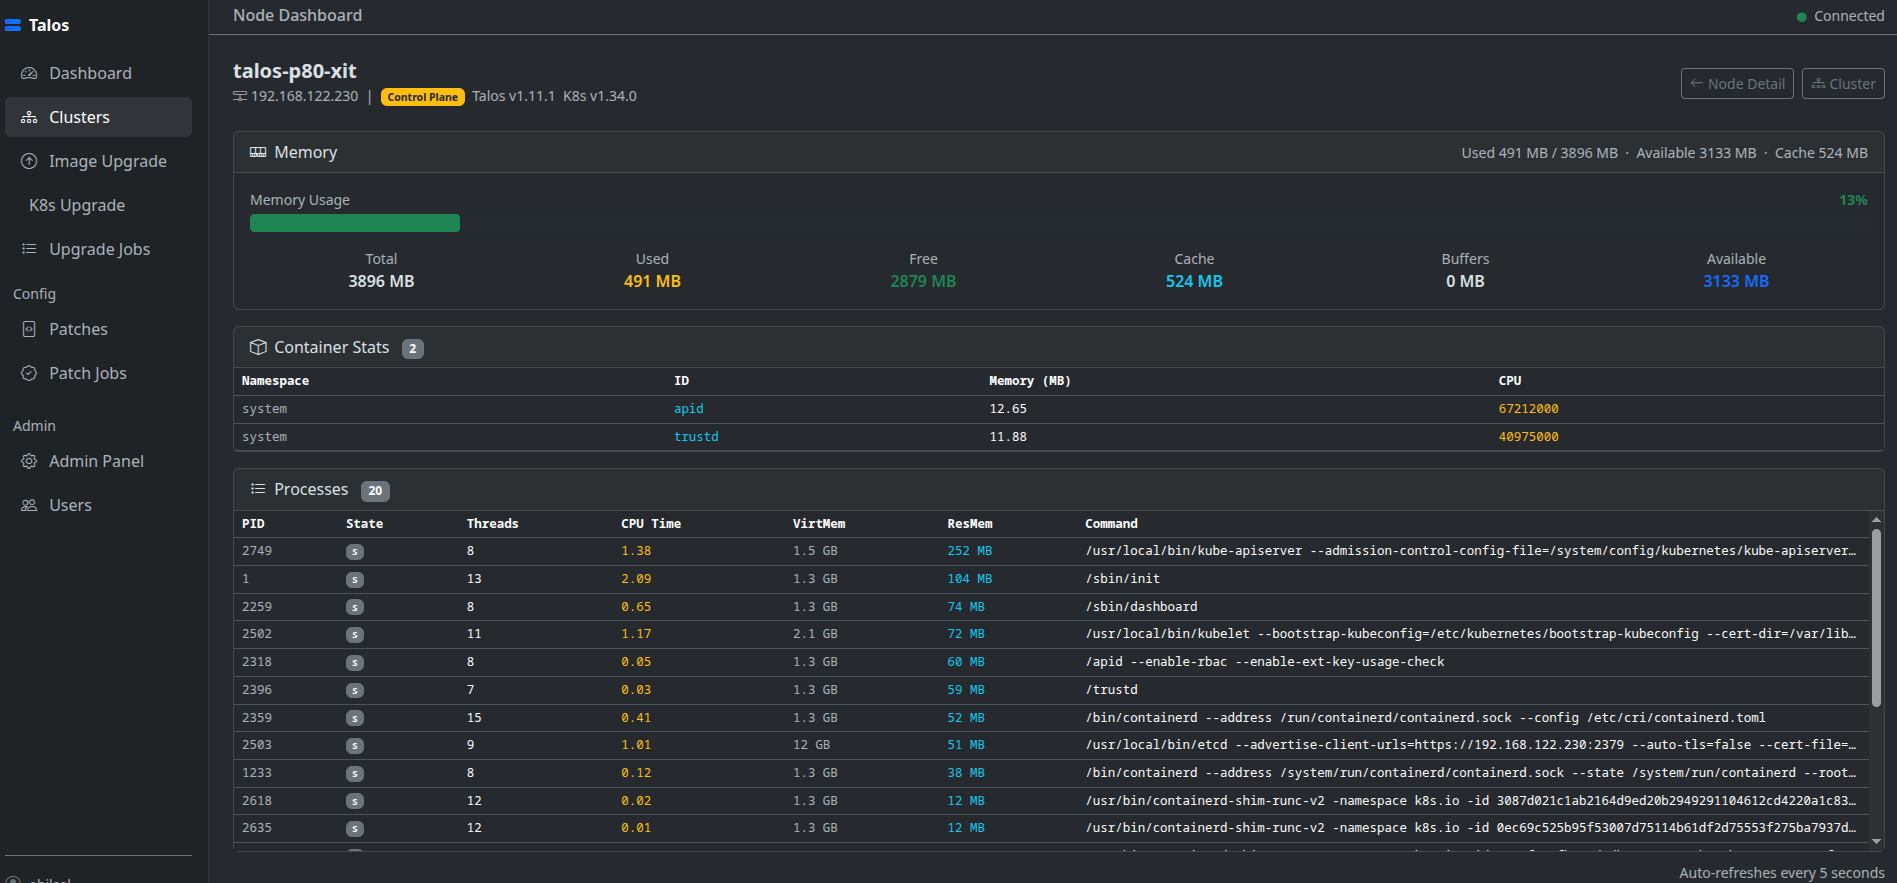
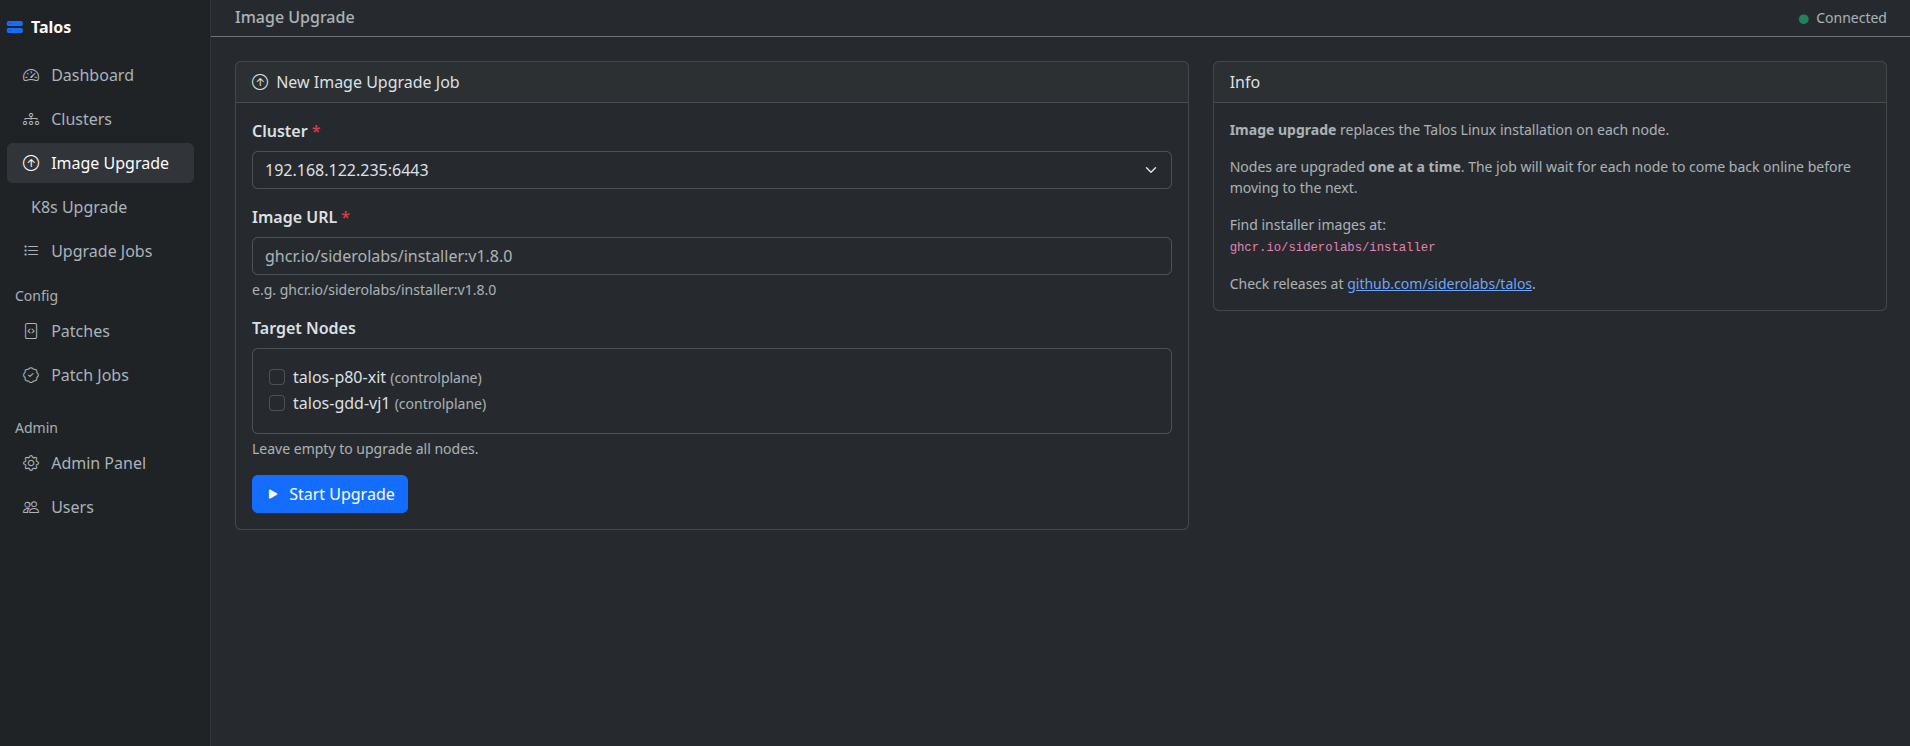
Node resource usage dashboard showing CPU, memory, disk metrics and process list

Image Upgrade

Upgrade Talos OS image on selected nodes with real-time streaming console output per node.
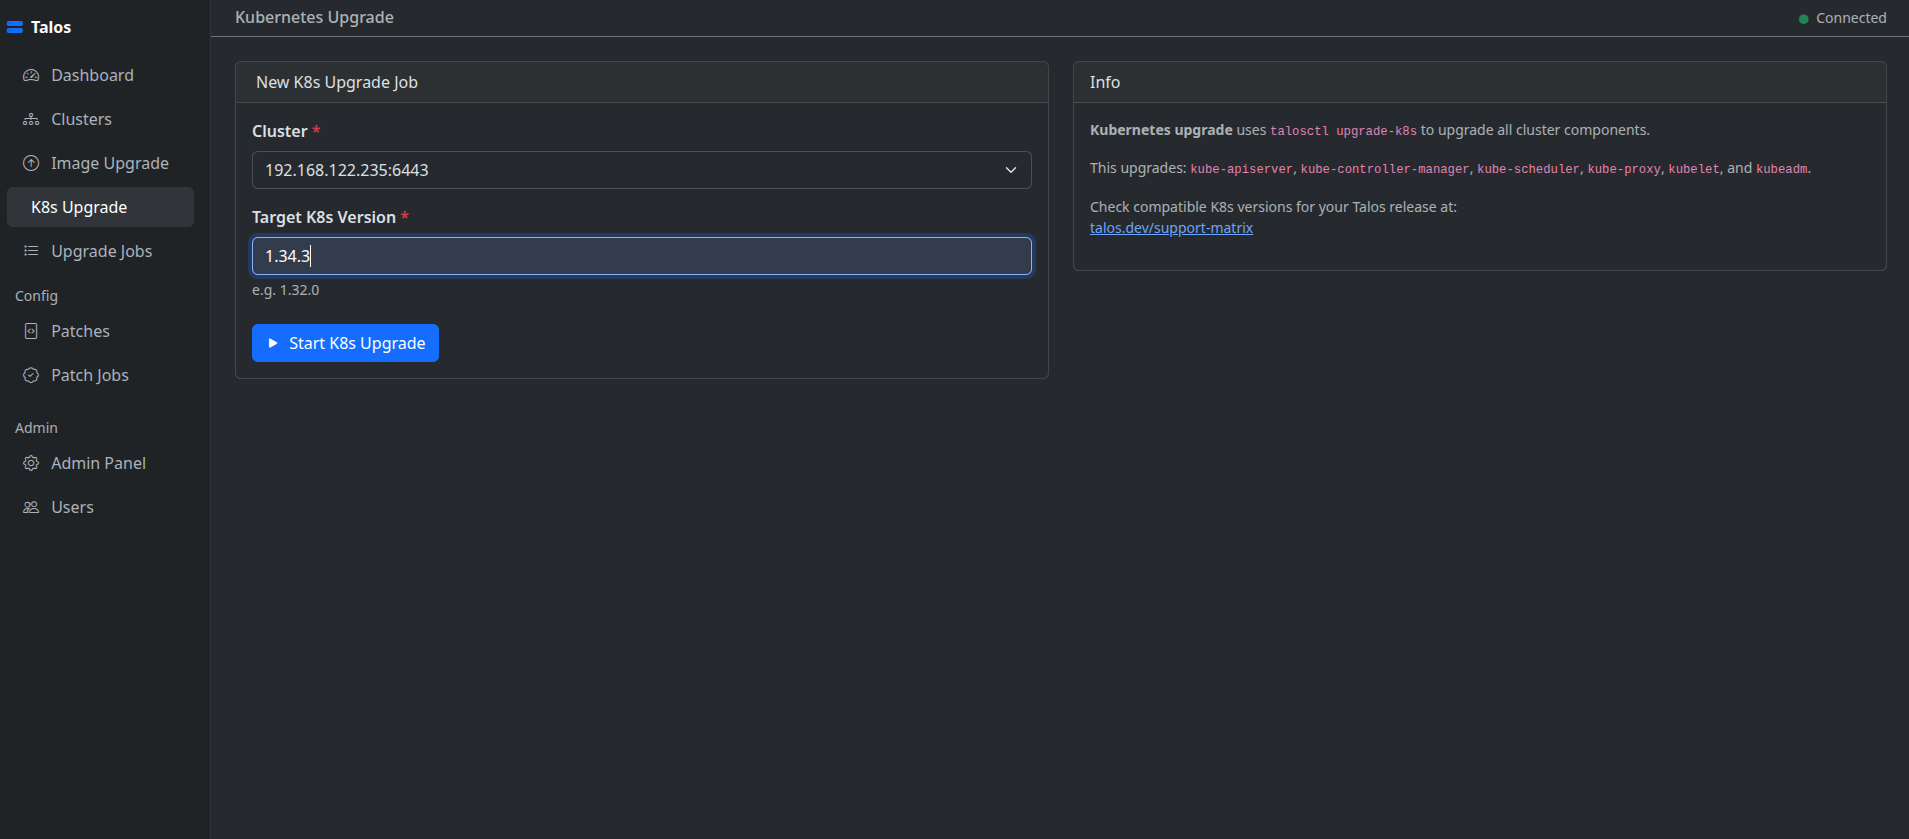
Talos OS image upgrade screen with real-time streaming console output

Kubernetes Upgrade

Upgrade the Kubernetes control plane with live log output streamed directly in the browser.
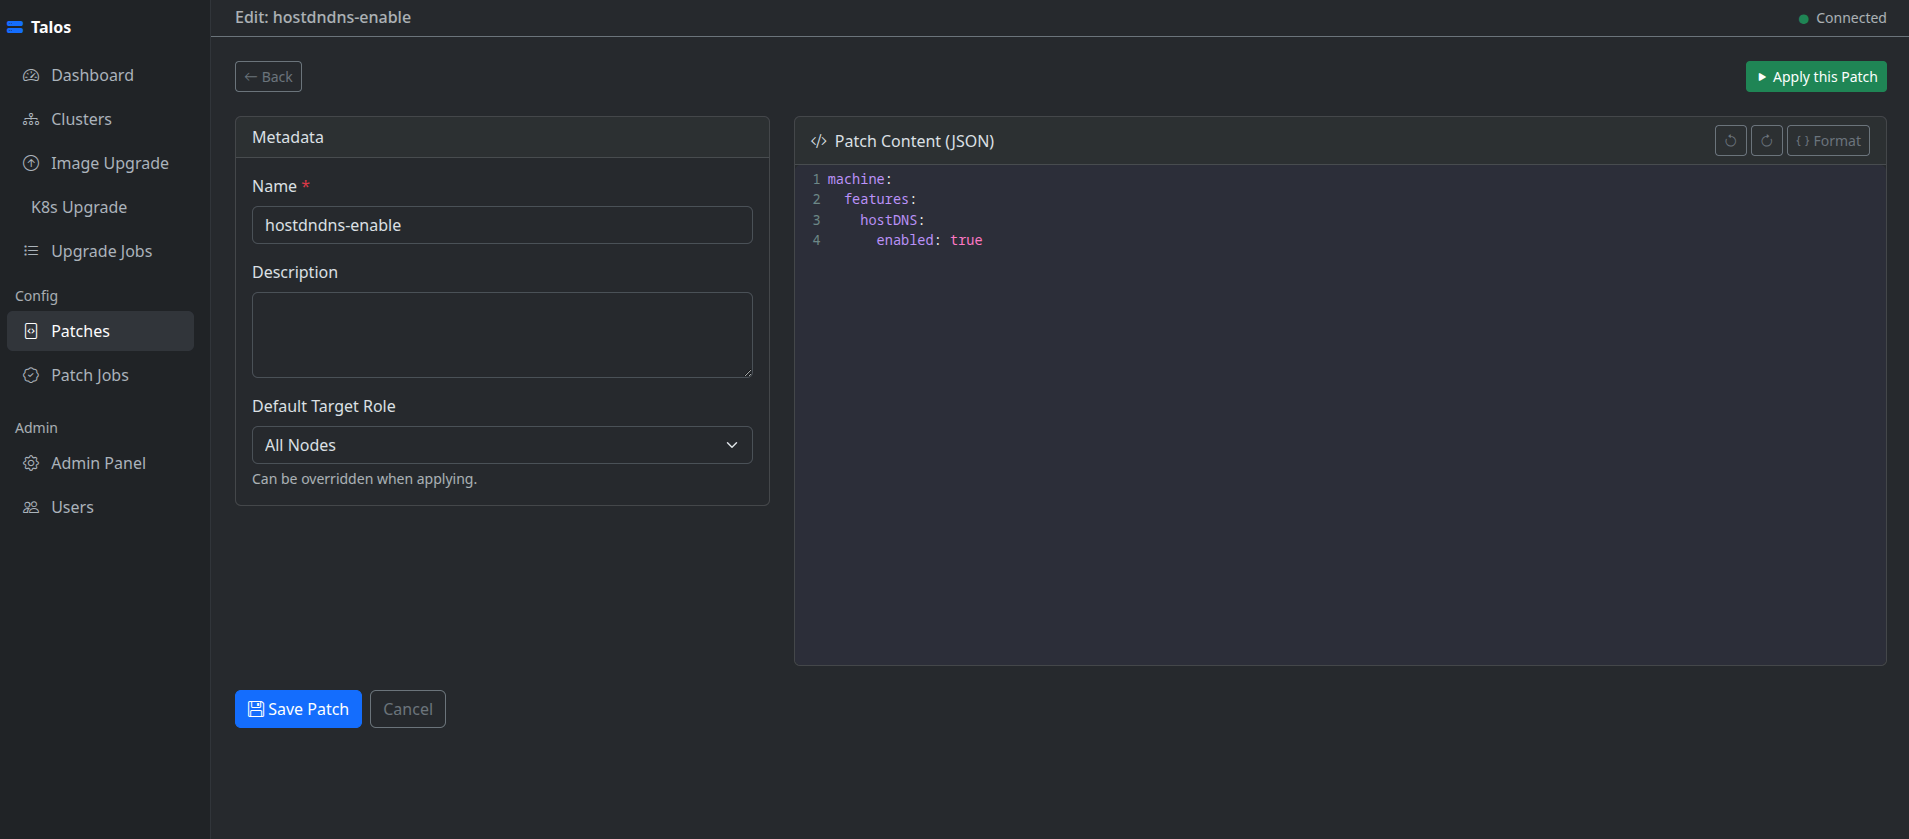
Kubernetes control plane upgrade with live log streaming in the browser

Patch Management

Apply JSON RFC 6902 or YAML merge patches to all nodes, control planes only, or workers. Real-time console per job.
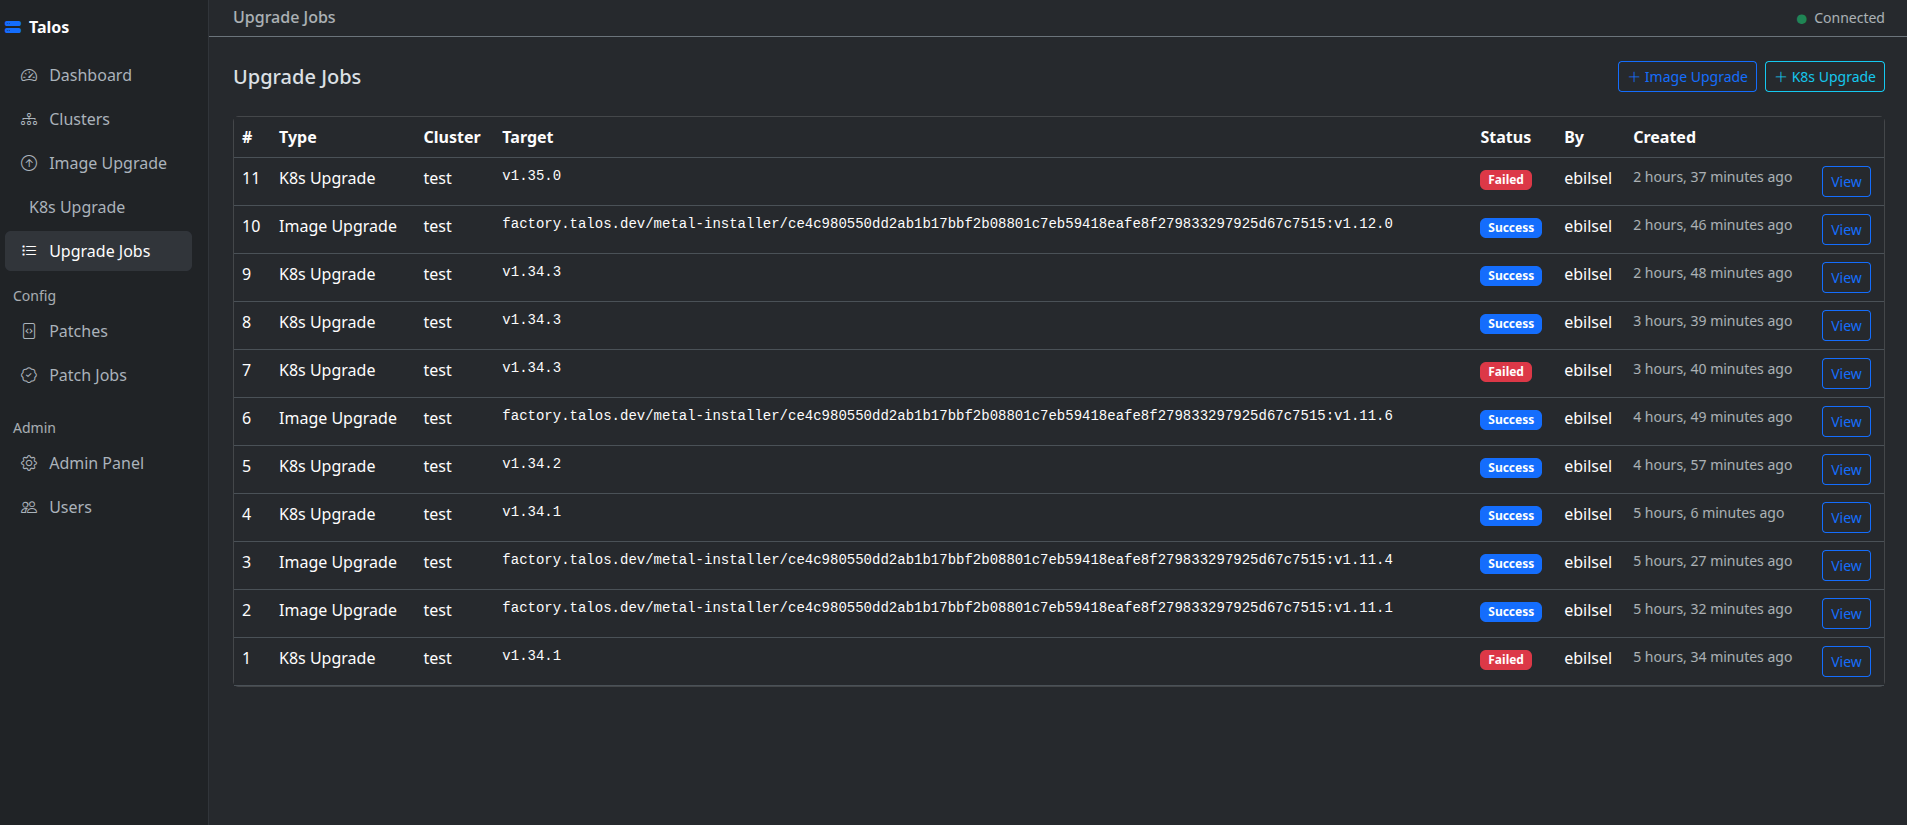
Patch management screen applying JSON or YAML patches to Talos nodes

Upgrade Jobs

History of all upgrade jobs with status, timestamps, and full console log replay.

Upgrade jobs history page with status, timestamps, and console log replay

About This Project

Talos Dashboard was built out of a real operational need: managing Talos Linux clusters through the command line is powerful but repetitive. Every reboot, config apply, or upgrade cycle meant juggling talosctl flags, YAML files, and multiple terminal windows. The goal was to bring all of that into a single, browser-based interface without giving up transparency or control.

The project wraps talosctl entirely via subprocess with shell=False throughout — no string interpolation, no shell expansion, no hidden attack surface. Talosconfig files are written to a temporary path with mode 0o600 and deleted immediately after each operation. Role-based access (admin / operator / viewer) is enforced at the view layer so teams can share the dashboard without sharing full cluster credentials.

Real-time feedback was a first-class concern from the start. Upgrade and patch operations stream output line-by-line to the browser over WebSocket using Django Channels and Celery, so you never have to tail a log file to know what is happening on a node. The same streaming approach powers live cluster events and node service logs.

The stack is intentionally straightforward: Django 5 on the backend, Bootstrap 5 + HTMX on the frontend, CodeMirror for in-browser YAML editing, and Redis as both the Celery broker and the Channels layer. SQLite works fine for a personal or small-team deployment; swapping to PostgreSQL for production requires a single settings change.

Contributions, bug reports, and feature requests are welcome via GitHub Issues.